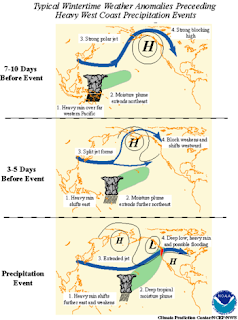
There are several forecast teleconnections/oscillations we look at besides the data that comes down from our very sophisticated numerical forecast weather models.
Here's what we're seeing....
This is the Madden Julian Oscillation Index. In general it is a measure of Deep Tropical convection in the Indian Ocean that oscillates around the globe, later affecting the West Coast of N. America (primarily in the Late Fall and Winter months). Over the last couple of weeks we have moved into a high amplitude 2/3 phase which later supports a wet pattern for Northern California.
You can see the high significance of a wet pattern for Northern California during active phase 2 and 3
A very simplistic animation of the MJO cycle
Another important blocking mechanism showing up on extended forecast models is a long and strong negative PNA (Pacific North American Teleconnection) phase. Most models are keeping us negative through the next 16 days.
BOTH IMAGES ARE ANOMALIES FOUND IN NEGATIVE PNA PHASE DURING A 28 YEAR CLIMATOLOGY
There is high significance in a strong negative phase and cold/upper level lows from the Gulf of Alaska setting up over Northern California and the Pacific Northwest
With cold upper level lows in place this also supports cold surface temperatures too.
MAPS BELOW ARE FROM THE 12z RUN OF THE 11-07-2012 GFS FORECAST MODEL RUN
Hints of our first strong cold front slowly moving in by day 10 (240 hrs out) next SaturdayVery strong and wet low pressure system moving in by hr. 288 the following Monday
Still wet through hr. 300
Even the very last frame (hr. 384), another extremely large wet and cold system moving towards Northern California.
Please do not takes these maps as exact forecast times and dates. The important thing to see is the overall pattern and trend, not individual weather events.


No comments:
Post a Comment