Wednesday, February 27, 2013

Meteorological Winter vs. Astronomical Winter

Tomorrow is the last day of "Meteorological Winter" for the Northern Hemisphere.  Lets take a look at the differences in the customary "Astronomical Winter," which ends on March 20th.


First of all we use Meteorological Winter because temperatures and weather are more similar during this period and slightly more evenly distributed.  

 Astronomical Winter occurs usually right around December 20th, plus or minus a day depending on the year.  The Winter Solstice for the Northern Hemisphere is when the sun angle above the horizon is at its lowest point of the year.  It is also the exact moment the direct sun angle passes over the Tropic of Capricorn in the Southern Hemisphere(their summer)

The Spring Equinox, which typically occurs around March 20th, again plus or minus a day.  The equinox occurs when the direct sun angle passes directly over the Equator. At this point in time Earth's axis points neither towards nor away from the direct rays of the sun.

Now let's take a look at some factors that differ during these two different classifications for winter.

You'll notice that from the Winter Solstice to another 3 weeks our AVERAGE temperature (based from Climate records) in Redding bottoms out to about 45 degrees.  So that Means the coldest 3 weeks of winter, on average occurs during the first 3 weeks of official winter.  You'll notice that Meteorological Winter is more even distributed.
Same thing goes for the sun angle above the horizon at noon.  The difference between the Solstice and the Equinox is 23.5 degrees.  And Meteorological Winter is 13.5 degrees, more even distributed.


For length of Daylight, the difference is nearly 3 hours between the Solstice and the Equinox.

In conclusion if we wanted a fully evenly distributed winter, it would make more since to start winter somewhere in mid to late November.

data source:  http://www.timeanddate.com/worldclock/astronomy.html?n=3260&month=1&year=2013&obj=sun&afl=-11&day=1


http://www.wrh.noaa.gov/climate/monthdisp.php?stn=KRDD&year=2013&mon=2&wfo=sto&p=temperature




Thursday, February 14, 2013

A Look Back at Valentine's Day 1977 "Heat" Wave

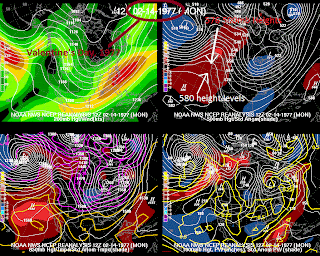
Today and tomorrow will feel like record highs in the valley floor. However, looking back to 1977 you can see just how warm we got up to on Valentine's Day.


(KRDD is the Redding Airport, records only go back
to 1986)

Here's our current set up over the next 24 hours.  Giant ridge of high pressure over the West Coast.  500 mb height levels will approach 576 dam)  Which is pretty high for this time of the year.


Now look back to 1977.   This image above is reanalysis form NOAA for Feb. 14th 1977.  We also saw a large West Coast ridge.  500 mb height levels were likely closer to 578-580 dam!

Today's 850 mb temperatures (about 4,000ft in elevation) are running near 9 degrees Celsius.  Bringing that air mass to the surface of the valley floor with condensing and warming, we are likely going to see some upper 70s today.  


Wednesday, February 13, 2013

Anomalous Warmth Followed by A Wet & Cold System Tuesday

The pattern the first 6 weeks of 2013 has been large blocking highs over the Northstate with weak systems every 10 days or so.  The latest ridge of high pressure continues to sit and amplify through the end of this work week.

(A look at Friday's anomaly afternoon highs.
You can see 10-20 degrees above normal highs)


The last 40 days the MJO has moved from phase 4 to 5 to 6 to 7 to 8 to 1 and now situated in Phase 2.  In the next few days the MJO index will move into phase 3 which is our wettest phase of the 8.  The MJO is one the biggest players in West Coast weather.


Here's a look at the all 8 phases compared to climate averages.  And you can clearly see how Phase 3 easily outweighs the other 7.


Our next system (pictured above) will rotate down from out of the North, Northwest Monday night and into Tuesday morning.  That trajectory is not the wettest route but this system will tap into a .80" PWAT plume (maybe under modeled at this time)

You can see the moisture tap out of the southwest with PWAT values (again maybe under represented) approaching .80" values.


GFS modeled precipitation by 10:00am next Tuesday morning.  850 mb temperatures would promote snow levels around 3,000ft and dropping.


GFS modeled precipitation by 4:00 pm on Tuesday, most of the Northstate under mountain snow and valley rain.

Accumulated snow with Tuesday's system.   This is extremely low-res modeling since we are still 6 days out. Look for better resolution and accuracy once we get within the range of the higher resolution forecast models.

Again extremely low-res modeling but you get the idea with total precipitation too.  Of course this image above is if everything fell in the form of rain.  I would expect maybe around a .50"of valley rain, unless we see the development of thunderstorms which would bump these totals.


Monday, January 21, 2013

Quiet Pattern Shifts To Slightly Active

For the last three weeks, thanks to a dampening MJO pattern and "Sudden Stratospheric Warming Event", the West has for the most part been situated under either amplified ridging or dry troughing.


The MJO (past and forecasted above) is now entering a somewhat amplified Phase 7.  For the last 3-4 weeks we went from no MJO to the very dry Phase 5 and 6 and now into Phase 7.


Take a look at the anomalies above for all 8 phases of the MJO.  Though not a soaking Phase, Phase 7 is a wetter pattern than the very dry phase 6-7, historically.

Something interesting that has been ingested in the models in the last 48 hours, is Air Force Flight Recon. data.  Flights went out in the Pacific to sample the southern stream of the jet stream.
From HPC......
ENOUGH SUPPORT/EVIDENCE DURING THE LAST 48
HOURS TO REQUEST A SERIES OF NOAA G4 WINTER RECON FLIGHTS TO
SAMPLE THE NORTH CENTRAL PACIFIC BETWEEN HAWAII AND ALASKA.


This extra and more accurate data has changed model output drastically for both Wednesday's system and this coming Weekend's system.


Though not strikingly wet, Wednesday's system is now trending much wetter than a nearly dry system seen just 36 hours ago.


The image above is the Euro forecast model's output for Saturday's system.  You can see a positively tilted trough about to slam in to Northern California.  This should supply at least enough energy for scattered showers and storms, if not some sort frontal precipitation shield.  Something to watch the next 5 days.


Tuesday, January 8, 2013

Wednesday's System & The Warm Weather Next Week

After the wet and wild November and December, January for the most part continues to be relatively quiet.  Yes every few days or so we see a weak system but rain and snow totals for the most part remain marginal.


Tomorrow's system (Wednesday), pictured above, is a positively tilted trough diving in from out of the north, northwest.  I drew the center of the axis to show you how it is tipping over (positively tilted).  Typically with these types of troughs, the moisture tap is weak and therefore precipitation amounts are low.  We look for neutral to negatively tiled troughs for the bigger and wetter storms.  This will however bring in some much colder air though.

Besides the typical orographic aided areas, the Northstate will only see from a .10" of rain for the valley and .25-.50" of precipitation for the mountains.  Snow levels will be around 2000', dropping as the system progresses with cold air filtering in behind the initial front. 

At 12:30 tomorrow afternoon you can see the initial band of precip working through the Northstate.  

By 4:30 tomorrow afternoon all of the precipitation has already eroded out of the valley and remains only in the foothills and mountains.

The image above is the accumulated snowfall by tomorrow night.  A lot of locations see snowfall but accumulations for the most part, very light.


Now lets take a look at the big picture.

What once was looking like an El Nino winter (last summer) has quickly faded and now transitioning into a possible weak La Nina.  But even the global climate models erode it away by this spring.


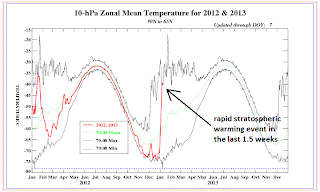
Something very interesting has happened in the last 1-2 weeks.  It is called a "Stratospheric Warming Event" it is a very complicated process that I'm and still scratching my head at but basically it means a shift in the polar vortex.  What is happening is the polar vortex is splitting and shift to another part of the Northern Hemisphere   This will likely bring much colder air to the lower 48 in the next couple of weeks.

This could possibly create a double "Rex Block."  1 block off the coast of the western North America and the other over Greenland.  Take a look at the image above of one operational forecast for February.  The big globs of red are prolonged ridging of high pressure.  This will then force all the cold air to pool and slide down into the lower 48 of the United States.  The question is how close is the block to the Northstate?  Too close and we'll be mild and dry, while the rest of the US freezes.


Lets take a look at a previous "Stratospheric Warming Event."  In December of 1984 prior to the "Event" you can see the west was cold and the east was warm.  

After the "Event" you'll notice how the Lower 48 was well below normal for the month of January in 1985.


Back to our weather.  Next week we'll see the ridge developing off the coast and moving towards the Northstate.  You can see the cold air starting to slide down from out of the Arctic, Canada and approaching the lower 48.


By next Friday the ridge is still over the Northstate and Rockies and east enter a deep freeze.

The MJO wave continue to strengthen this week.  However, it is entering a dry, cooler phase for Northern California.  You'll notice the forecast (yellow/green line)  is moving into a Phase 5 and 6 in the near future.


Comparing the winter anamolies for a phase 5 and 6 shows a dry phase.  The image above has all 8 phases. Look for phase 5 and 6 and map and you'll notice the brown over Northern California, which is drier than average.


Phase 5 and 6 are actually cooler phases for Northern California so we'll see how it interacts with the "Stratospheric Warming Event."


Thursday, December 27, 2012

Quiet Pattern With a Few Weak Systems


After what has been a very active last 30 days we for the most part, take a break.  Every few days or so we will see a weak system that will try to move in, likely dropping  .10" of precip for the valley or less.


Tomorrow's system will hug the coast, split and head south.  Moisture tap will be extremely light so only expecting scattered snow showers in the mountains and a shower or two sneaking down to the valley.


Another weak system will move through Monday.  This is more of a hybrid slider system that will likely bring more wind than rain for most of the Northstate.  The backside of the storm will be a north to south jet axis, that will tighten the surface pressure gradient.  Expect a slight breeze out of the north.


And again another weak system Wednesday evening that will likely hug the coast and dip south.  3 very weak systems that are all starved for moisture over the next 7 days.

After what seemed like an eternity.  the Pacific North American index (teleconnection we look at for blocking in the North Central Pacific) finally went positive after a month and a half negative.  Due to less blocking, big powerful troughs are unable to be nudged down from the Gulf of Alaska to the Northstate.

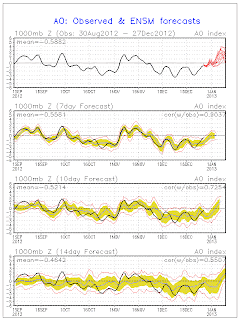
The Arctic Oscillation continues to push positive and looks to remain positive through the extended period.  AO is a slight measure of how wavy and troughy the jet stream is.  The more negative the more rosby waves can build up on the jet stream, bringing us a better shot at big storms.

And finally the Madden Julian Oscillation continues to be nonexistent.  A very low amplitude wave that is forecasted to meander in the Phase 4/5, which is unfavorable pattern for West Coast storms.  So for now things quiet down.


Wednesday, December 19, 2012

Significant Mountain Snow Event

Though Northern Valley snow still remains a challenge and uncertain, there is certainty that the Northern Shasta, Northern Trinity and Southern Siskiyou mountains will see a tremendous amount of snow.

The image above is the 5-day QPF (Quantitative Precipitation Forecast) from the NWS.  Basically this means if everything that were to fall in the form of liquid or if you converted it to rain this is how much precipitation you could expect.  And as you can see Northern Shasta, Southern Siskiyou county get painted with 7-8" of liquid.  Forecast rain-to-snow ratios are right around 1:11" averaged out for the entire event.  So you're talking 77-88" of snow.  This is likely overdone but fascinating none the less.

As you can see HPC is also leaning between 7-9" of QPF too.

Here is the 72 hour snowfall accumulation map.  Unfortunately it only goes out until 10:00am Saturday.  But right in that bullseye I showed you above you can see where our in-house model is picking up 60-72" of snow in the Mount Shasta City area through Saturday morning, not including the rest of Saturday's or Sunday storm too.

HOW ABOUT THE VALLEY?

This is the million dollar question.  In the last 18 hours, forecast models have drastically slowed down the initial storm.  This will play a major role in the chances for valley snow.  


At 5:00 am Thursday morning there is actually quite the clearing on the forecast Satellite over Redding.  So we could see some decent radiational cooling.

By 8:00am Thursday morning you can see some decent cloud cover has moved over about Red Bluff and North.  So maybe enough cloud cover to lock the cold air in place.

The Biggest challenge of the Forecast is the winds.  We are expecting strong south winds for most of the valley.  IF the winds make it into Redding then our chances for accumulating snow are greatly reduced to near 0.

Here some forecasts of the winds tomorrow morning.
As of 11:30 tomorrow morning the strong south winds are south and southeast of Redding, unable to penetrate the cold air-mass.

The rest of the day the winds try to increase near Redding but still the south winds are not as strong as the winds south and southeast of Redding.


The image above is the Forecast Skew T sounding for Redding at 10:00 am tomorrow morning.  The surface air column is still not fully saturated.  But the 0-degree wet bulb height is 377ft, which means that at that time if enough precipitation were to fall it would be 32 degrees F or 0 degrees C at 377ft elevation.  *****The wet bulb temperature is the temperature the air would fall to at full saturation (through evaporative cooling)  However models continue to show precipitation not moving in until after 12:00pm.


By 1:00pm you can now see that air still not fully Saturated and the 0-degree Wet Bulb temperature has now risen to over 1300 ft.

Just because it is not freezing at the surface (Redding's elevation is between 500-900ft) doesn't mean and can't snow.  Redding this past Saturday saw several hours of snow with a temperature of 34 degrees.  Also if the precipitation is hard enough it can bring the cold air down with it and not have enough time to melt.  So overall it appears that for Redding to see snow the earlier the better, which hasn't been in our favor the last few model runs and we are running out of time.


At 8:30 Thursday evening you can see that the rain/snow line is hovering right on or just slightly north of Redding.

That's what makes this forecast so difficult because the rain/snow line is going to hover right over Redding through tomorrow evening, tomorrow night.  Eventually Redding will switch over to rain, washing away any accumulations that we could possibly see.

Stay tuned, things seem to change from one model run to another.