Wednesday, February 27, 2013

Meteorological Winter vs. Astronomical Winter

Tomorrow is the last day of "Meteorological Winter" for the Northern Hemisphere.  Lets take a look at the differences in the customary "Astronomical Winter," which ends on March 20th.


First of all we use Meteorological Winter because temperatures and weather are more similar during this period and slightly more evenly distributed.  

 Astronomical Winter occurs usually right around December 20th, plus or minus a day depending on the year.  The Winter Solstice for the Northern Hemisphere is when the sun angle above the horizon is at its lowest point of the year.  It is also the exact moment the direct sun angle passes over the Tropic of Capricorn in the Southern Hemisphere(their summer)

The Spring Equinox, which typically occurs around March 20th, again plus or minus a day.  The equinox occurs when the direct sun angle passes directly over the Equator. At this point in time Earth's axis points neither towards nor away from the direct rays of the sun.

Now let's take a look at some factors that differ during these two different classifications for winter.

You'll notice that from the Winter Solstice to another 3 weeks our AVERAGE temperature (based from Climate records) in Redding bottoms out to about 45 degrees.  So that Means the coldest 3 weeks of winter, on average occurs during the first 3 weeks of official winter.  You'll notice that Meteorological Winter is more even distributed.
Same thing goes for the sun angle above the horizon at noon.  The difference between the Solstice and the Equinox is 23.5 degrees.  And Meteorological Winter is 13.5 degrees, more even distributed.


For length of Daylight, the difference is nearly 3 hours between the Solstice and the Equinox.

In conclusion if we wanted a fully evenly distributed winter, it would make more since to start winter somewhere in mid to late November.

data source:  http://www.timeanddate.com/worldclock/astronomy.html?n=3260&month=1&year=2013&obj=sun&afl=-11&day=1


http://www.wrh.noaa.gov/climate/monthdisp.php?stn=KRDD&year=2013&mon=2&wfo=sto&p=temperature




Thursday, February 14, 2013

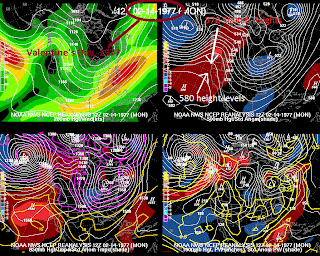
A Look Back at Valentine's Day 1977 "Heat" Wave

Today and tomorrow will feel like record highs in the valley floor. However, looking back to 1977 you can see just how warm we got up to on Valentine's Day.


(KRDD is the Redding Airport, records only go back
to 1986)

Here's our current set up over the next 24 hours.  Giant ridge of high pressure over the West Coast.  500 mb height levels will approach 576 dam)  Which is pretty high for this time of the year.


Now look back to 1977.   This image above is reanalysis form NOAA for Feb. 14th 1977.  We also saw a large West Coast ridge.  500 mb height levels were likely closer to 578-580 dam!

Today's 850 mb temperatures (about 4,000ft in elevation) are running near 9 degrees Celsius.  Bringing that air mass to the surface of the valley floor with condensing and warming, we are likely going to see some upper 70s today.  


Wednesday, February 13, 2013

Anomalous Warmth Followed by A Wet & Cold System Tuesday

The pattern the first 6 weeks of 2013 has been large blocking highs over the Northstate with weak systems every 10 days or so.  The latest ridge of high pressure continues to sit and amplify through the end of this work week.

(A look at Friday's anomaly afternoon highs.
You can see 10-20 degrees above normal highs)


The last 40 days the MJO has moved from phase 4 to 5 to 6 to 7 to 8 to 1 and now situated in Phase 2.  In the next few days the MJO index will move into phase 3 which is our wettest phase of the 8.  The MJO is one the biggest players in West Coast weather.


Here's a look at the all 8 phases compared to climate averages.  And you can clearly see how Phase 3 easily outweighs the other 7.


Our next system (pictured above) will rotate down from out of the North, Northwest Monday night and into Tuesday morning.  That trajectory is not the wettest route but this system will tap into a .80" PWAT plume (maybe under modeled at this time)

You can see the moisture tap out of the southwest with PWAT values (again maybe under represented) approaching .80" values.


GFS modeled precipitation by 10:00am next Tuesday morning.  850 mb temperatures would promote snow levels around 3,000ft and dropping.


GFS modeled precipitation by 4:00 pm on Tuesday, most of the Northstate under mountain snow and valley rain.

Accumulated snow with Tuesday's system.   This is extremely low-res modeling since we are still 6 days out. Look for better resolution and accuracy once we get within the range of the higher resolution forecast models.

Again extremely low-res modeling but you get the idea with total precipitation too.  Of course this image above is if everything fell in the form of rain.  I would expect maybe around a .50"of valley rain, unless we see the development of thunderstorms which would bump these totals.